
Google Sheets walkthrough
Published:
How to get a CSV (comma separated values) file into a spreadsheet using Google Sheets and get working with it.
IMPORTING YOUR FILE
Download the following file to your computer: bags_2years.csv
Once the file is on your computer, right-click on it and under Open With choose Text Edit (Mac) or WHAT(Windows) to look at what’s actually in the file. All the values are separated by commas:
In your own Google Drive, open a new Sheet by clicking + New, then Google Sheets, then Blank Spreadsheet
In the new Sheet, click on the name Untitled Spreadsheet on the top left and give your Sheet a name
Under File select Import, then Upload
Choose your bags_2years.csv file from your computer
If asked in a dialogue box about Import Location, select Insert New Sheet and for Separator Type, choose Comma or Detect Automatically
You should now have the CSV file in your Sheet:
ORGANISING YOUR SHEET
In the bottom left, there is a tab called bags_2years. Right click on the tab and select Duplicate. This will generate a new Sheet with a tab called Copy of bags_2years. Double click on this tab and rename it as data.
Add a new empty Sheet by using the + button just to the left of the tabs. Give this the name Source and somewhere in the sheet paste the following url, which is the where the data in your file was taken:
— https://data.gov.uk/dataset/682843a8-168c-4056-b6fe-741161a39f60/single-use-plastic-carrier-bags-charge-data-for-england
THE DATA
At this point we have imported the CSV file to a Sheet, we have named the Sheet and we have duplicated it so that we have a copy of the original data if we need it. We’ve also added the source for the data so that we you come back to work on this in six months we’ll know where the data came from.
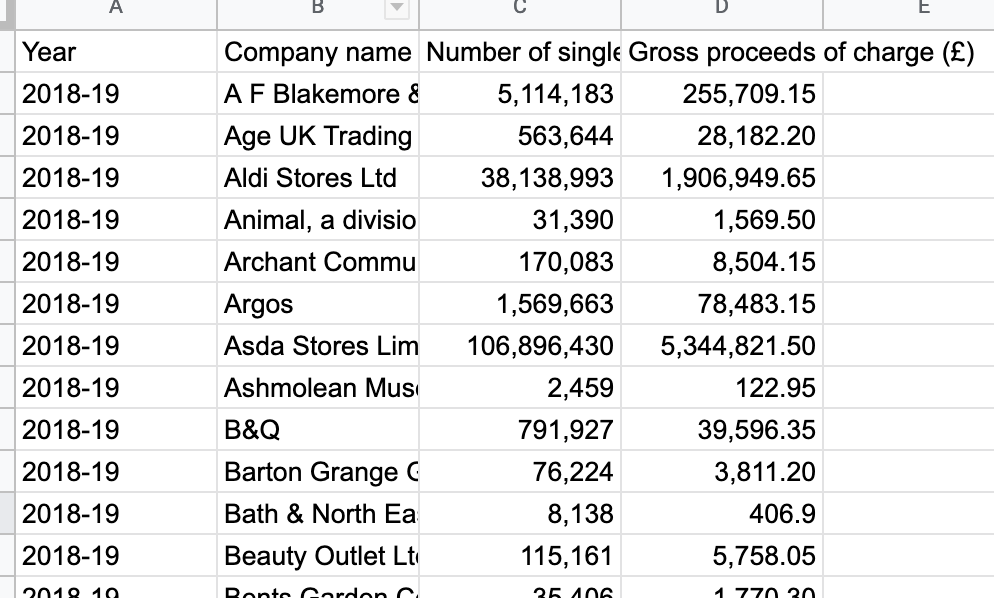
If you look at the data, you’ll see you have four columns:
- Year
- Company name
- Number of single use plastic bags issued
- Gross proceeds of charge (£)
These are companies in England that charged customers for single-use plastic bags in 2018-19 and 2019-20. It shows how many bags each retailer issued and how much money it collected from charging customers for them. The data was published in 2020 by DEFRA, the Department for Environment, Food and Rural Affairs.
NAVIGATING THE SHEET
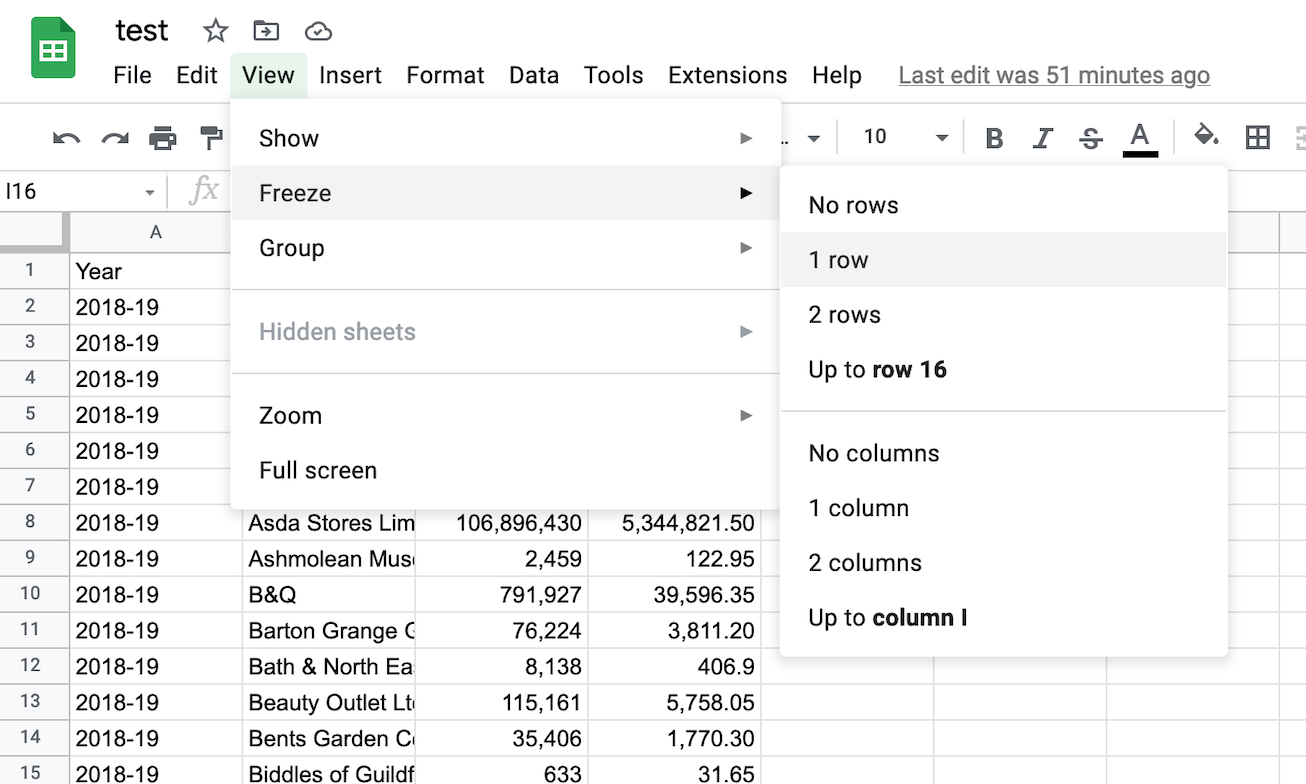
Under the menu View, choose Freeze then 1 row. This will maintain the column names in place as you scroll down through the sheet.
You can adjust the width of the four columns.
Now, see if you can repeat all those steps with a different file: the same data but for two earlier years, 2016 and 2017