
A(nother) month of traffic counted
Published:
The We Count Project started in Belgium in 2019 and a year ago it expanded to several other European countries. My sensor in Cardiff now has two months of data gathered by looking out of my house onto a quiet residential street while there’s daylight, in one-hour slices.
Constant bikes
The busiest hour between December and January saw a bike on the street every 90 seconds (the morning of New Year’s Eve) but on average it’s just a little busier than one bicycle every ten minutes. There are times when no cyclists go past but generally it’s remarkably constant: if you wait two days, on average, there will be a bicycle-free hour but otherwise every hour sees at least one cyclist appear.
There is never a day without a cyclist.
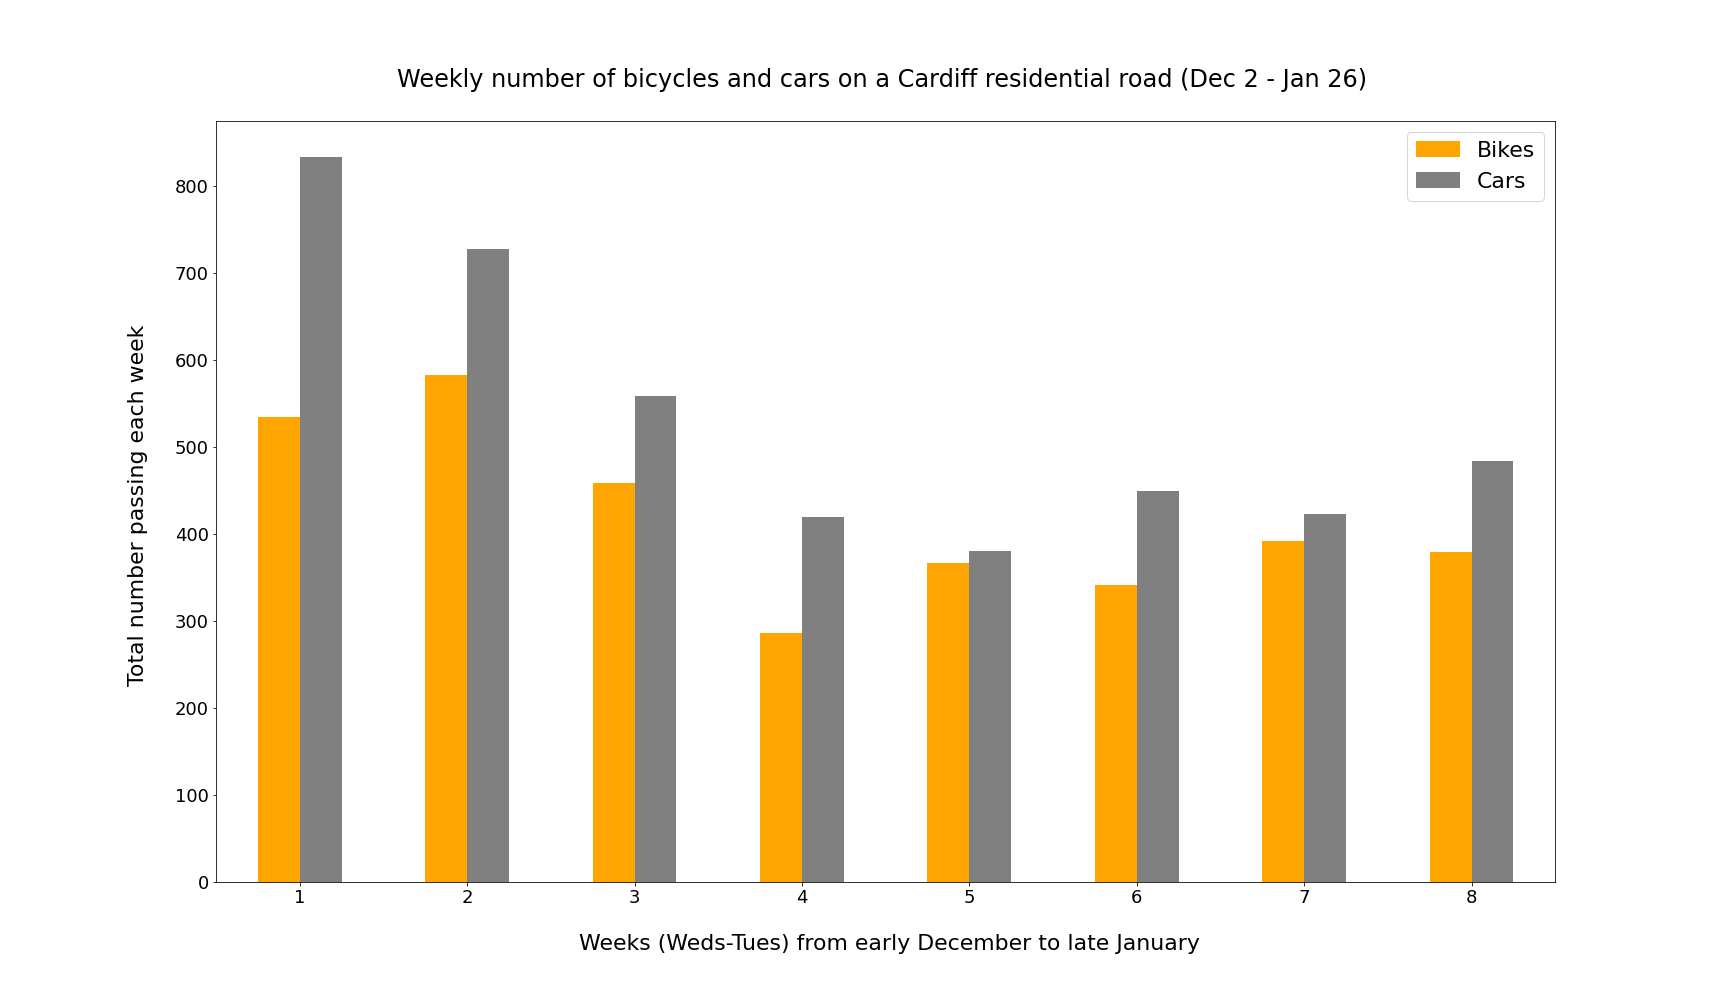
Bikes outnumber cars more than a quarter of the time, i.e. for more than a quarter of the one-hour slices in the period. This, I think, is higher than I would have guessed. Admittedly, mine is not a very useful route for cars — see Context, below — but the fact that for two hours a day (on average) there are more bikes than cars on a Cardiff road is one that cycling advocates will point to as evidence that “it can be done”.
Even if we include bigger vehicles, bikes still outnumbered all vehicles in 20% of the hourly counts. Viewed weekly of course, there are always more cars.
I live on a quiet street where a lot of residents have cars to park (and deliveries to receive) but it’s quite a few turns off the main roads so doesn’t have a lot of through traffic.
There are other questions to be answered with this data (i.e. not about bikes): What kind of speeds do vehicles do on a residential road like this? How many vans pass by (now that we’re all online doing our pandemic shopping)? What are the trends for pedestrians?
The data and the Jupyter notebook are on github.