WALKTHROUGH: Get a CSV file into a spreadsheet
Background. Since 2015, shoppers in England have had to pay a 5p levy for single-use plastic bags (except in smaller shops). This was increased to 10p in May 2021 and extended to all shops. Larger retailers not only have to charge customers but must also collect data on the numbers of bags given to customers, the money collected and what they did with the money. The steps below walk through how to get some of this data into a spreadsheet and start to analyse it.
- Higher plastic bag charge comes into force in England (BBC)
- Government guidance to retailers on carrier bag charges
IMPORTING YOUR FILE
Download this CSV file to your computer
Once the file is on your computer, right-click on it and, under Open With, choose the Text Edit or Notepad programme to look at what’s actually in the file
It’s a bit of a jumble but you can see that all the pieces of information are separated by commas:
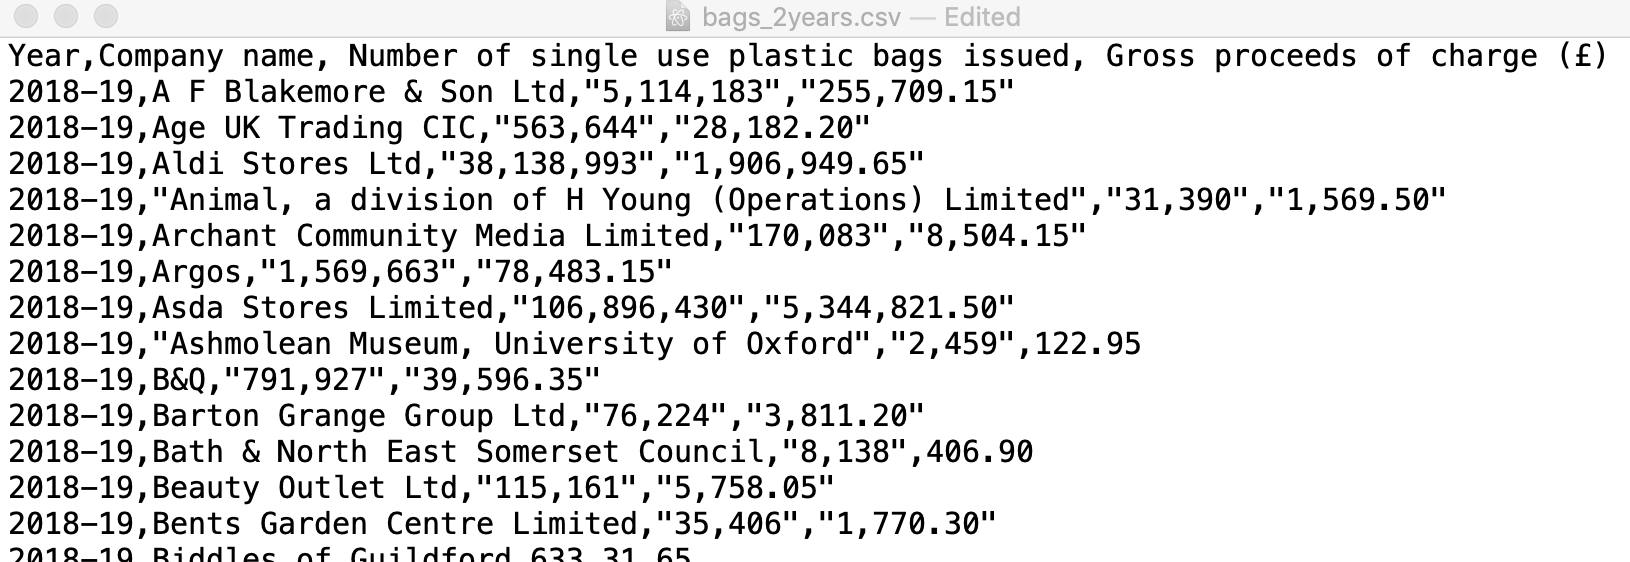
Close the file
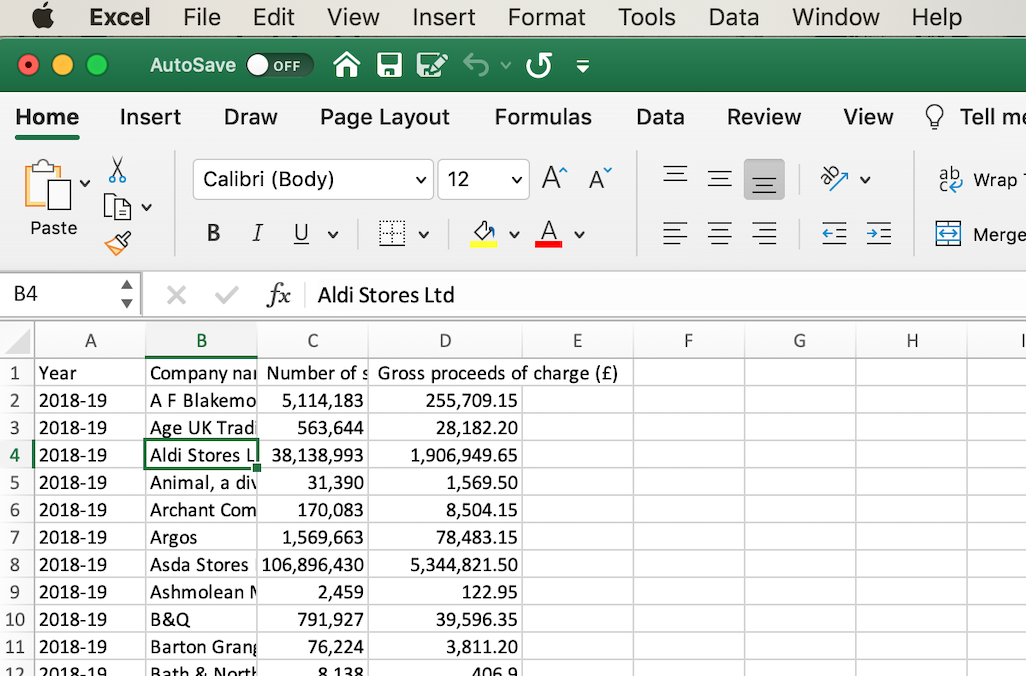
Right-click on the file again and this time, under Open With, choose Microsoft Excel. (Or you can open it from within Excel using File and Open)
We should now have the data from the CSV file in our spreadsheet:
ORGANISING YOUR SHEET
Adjust the width of the columns (Widen or narrow by dragging the column dividers that separate the letter names):
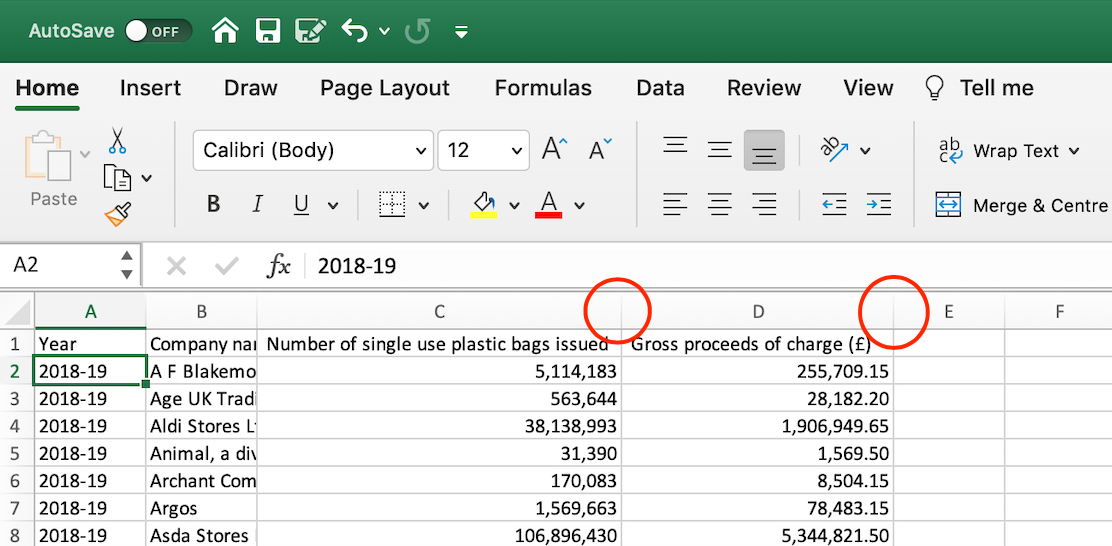
There are several data types here and numbers are aligned on the right, while text is aligned on the left
In the bottom left, your sheet will have a tab called bags_2years. Right click on the tab and select Move or Copy:
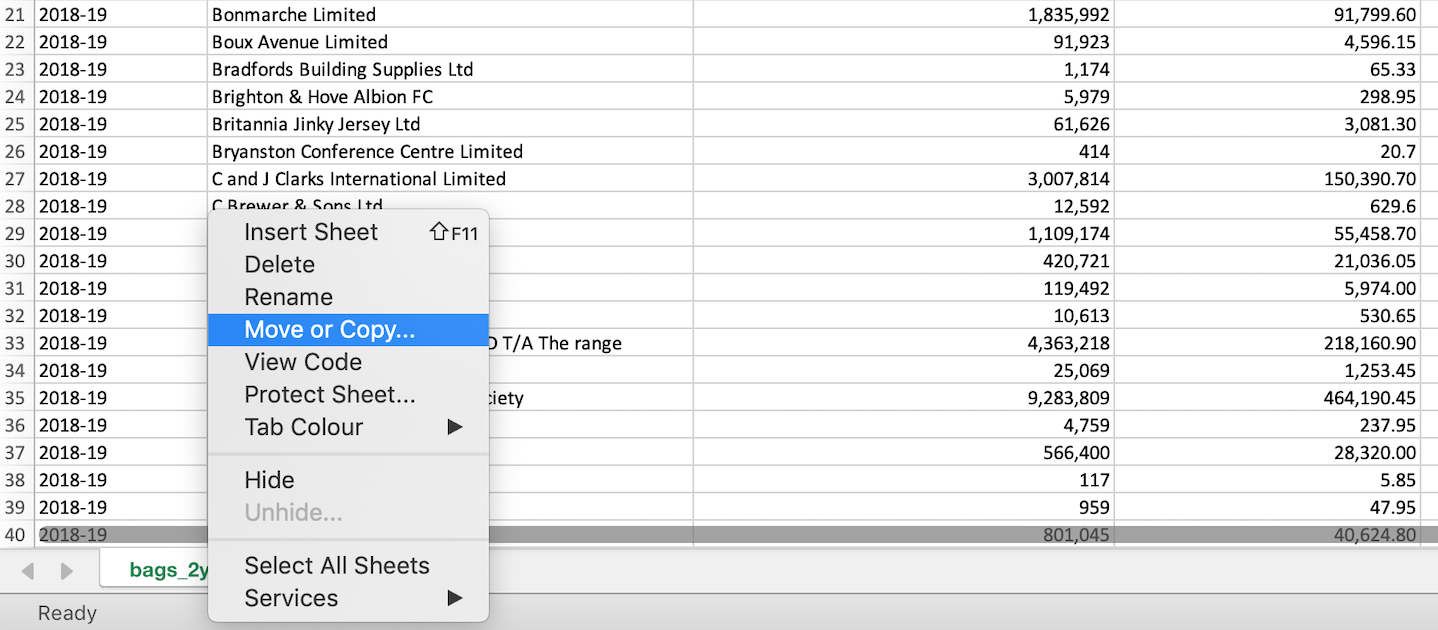
Tick the Create a copy box and OK and this will generate a copy of your sheet
Double click on the tabs to rename them as ‘original’ and ‘data’
Add another sheet by using the + button just to the right of the tabs. Give this sheet the name Source and somewhere in the sheet paste the following url, which is the where the data in your CSV file came from:
- https://data.gov.uk/dataset/682843a8-168c-4056-b6fe-741161a39f60/single-use-plastic-carrier-bags-charge-data-for-england
You can drag the tabs left and right to reorder them
THE DATA
At this point we have imported the CSV file to a spreadsheet, we have named the sheet and we have duplicated it so that we have a copy of our initial data if we need it later
We’ve also added the source for the data so if we come back to work on this in six months we’ll know where the data came from
Our data has four columns:
- Year
- Company name
- Number of single-use plastic bags issued
- Gross proceeds of charge
It shows how many single-use plastic bags each major retailer issued in England in 2018-19 and 2019-20, and how much money each collected from charging customers for the bags. The data was published in 2020 by the Department for Environment, Food and Rural Affairs (DEFRA).
NAVIGATING THE SHEET
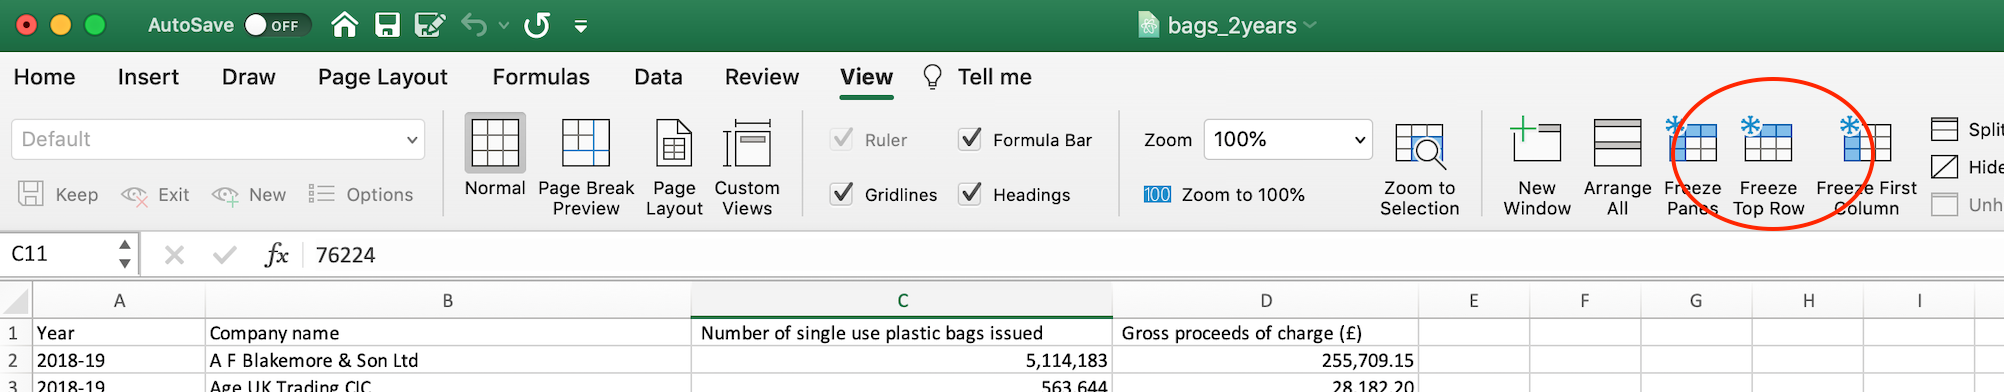
Under the View tab at the top of the workspace, choose Freeze Top Row. This will keep the column names in place as you scroll down through the sheet.
Use CMD / CTRL and a down arrow to jump to the bottom of the dataset. Use CMD / CTRL and a right arrow to jump to the right of the dataset and so on.
Use CMD / CTRL and an arrow and SHIFT to select all the cells when you jump to the edge of the dataset.
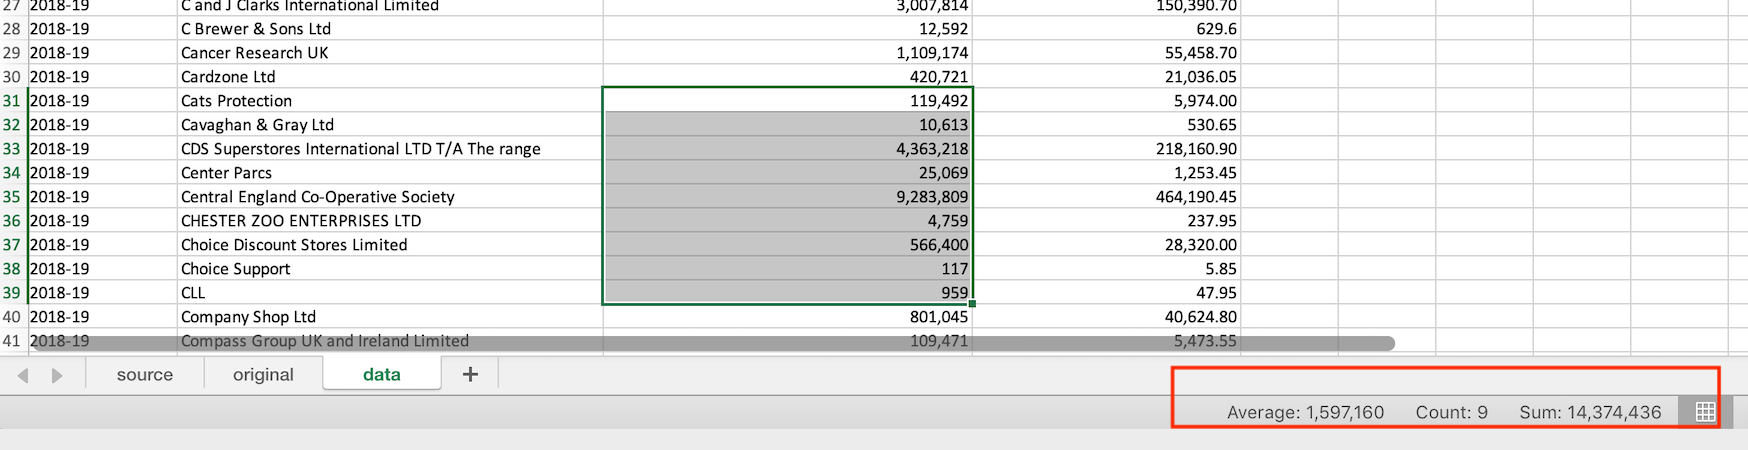
Select a small group of cells. On the bottom right the sheet will automatically supply basic calculations (if the cells have numbers) or will supply a simple count of how many cells are in the selection (if the cells have text).
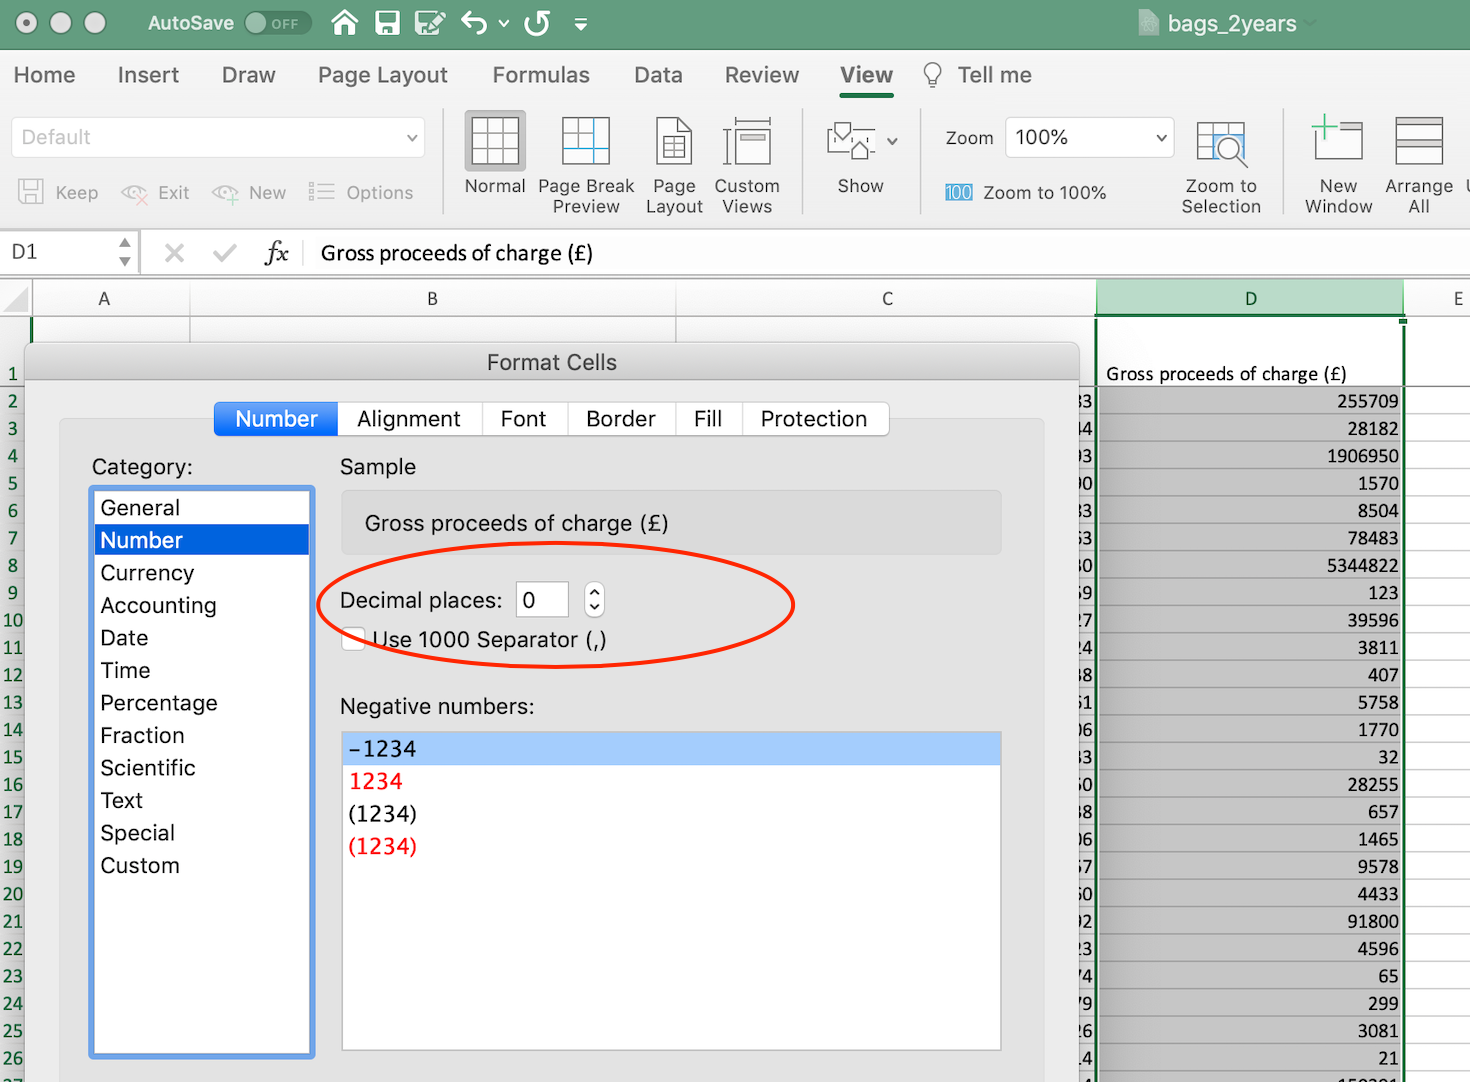
The column that lists the money collected (D) includes two decimal places that show pence, but we don’t need this level of detail. Select the entire column by clicking on the letter D.
In the menu open Format/Cells and under Number / Category choose Number. Adjust the number of decimal points to show 0. Tick the box for ‘1000 separator’ if you want to show 2000 as 2,000.
SORT & FILTER
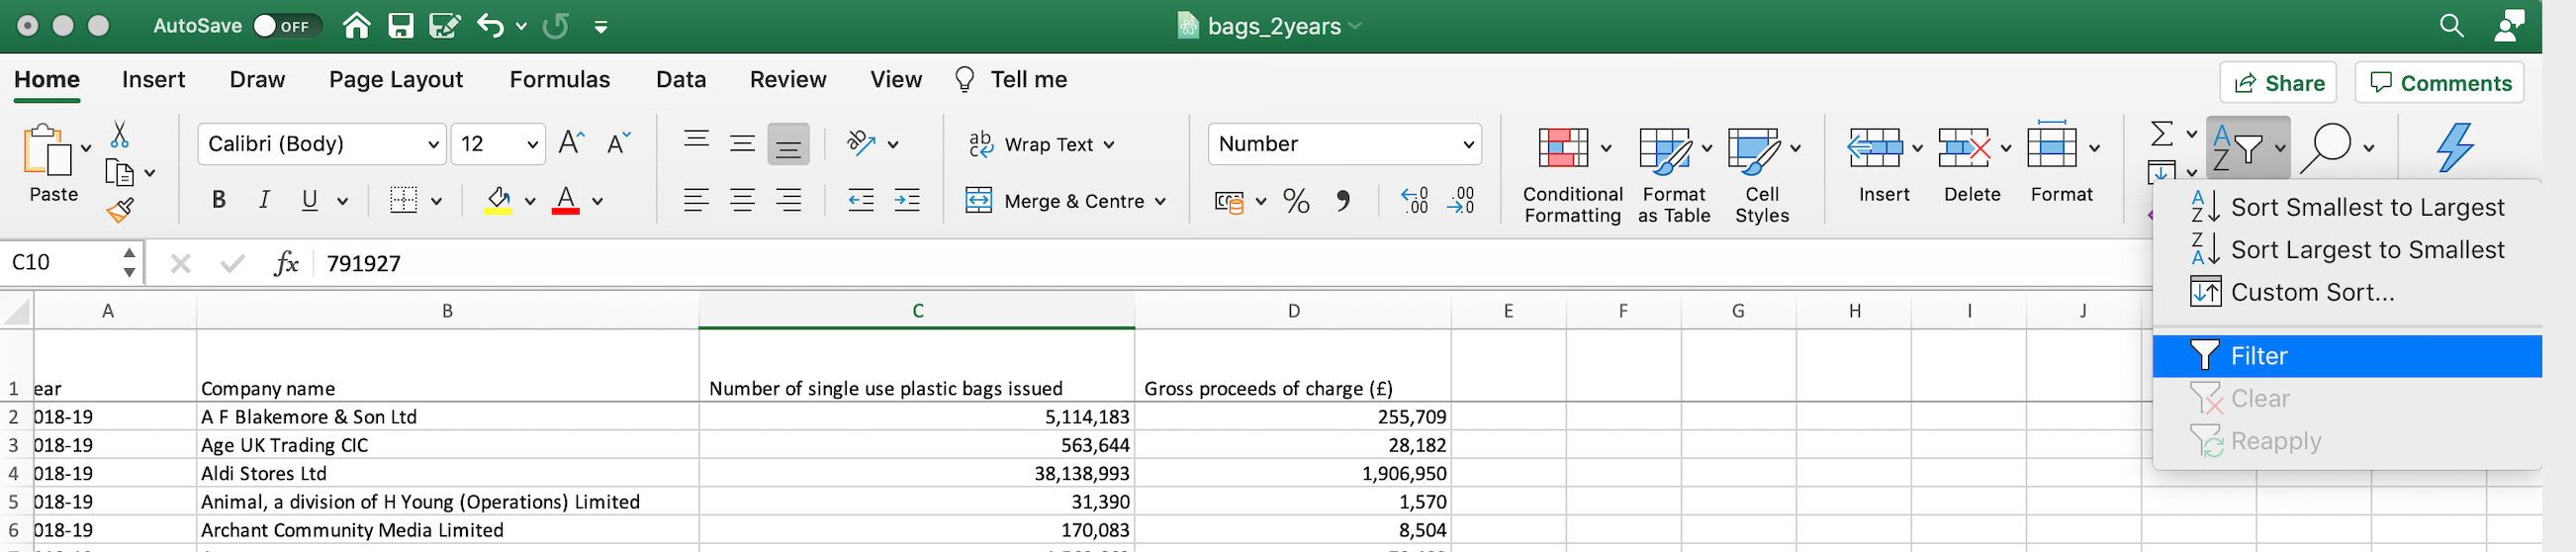
Select any cell in your data. In the Home tab, go to Sort & Filter and choose Filter
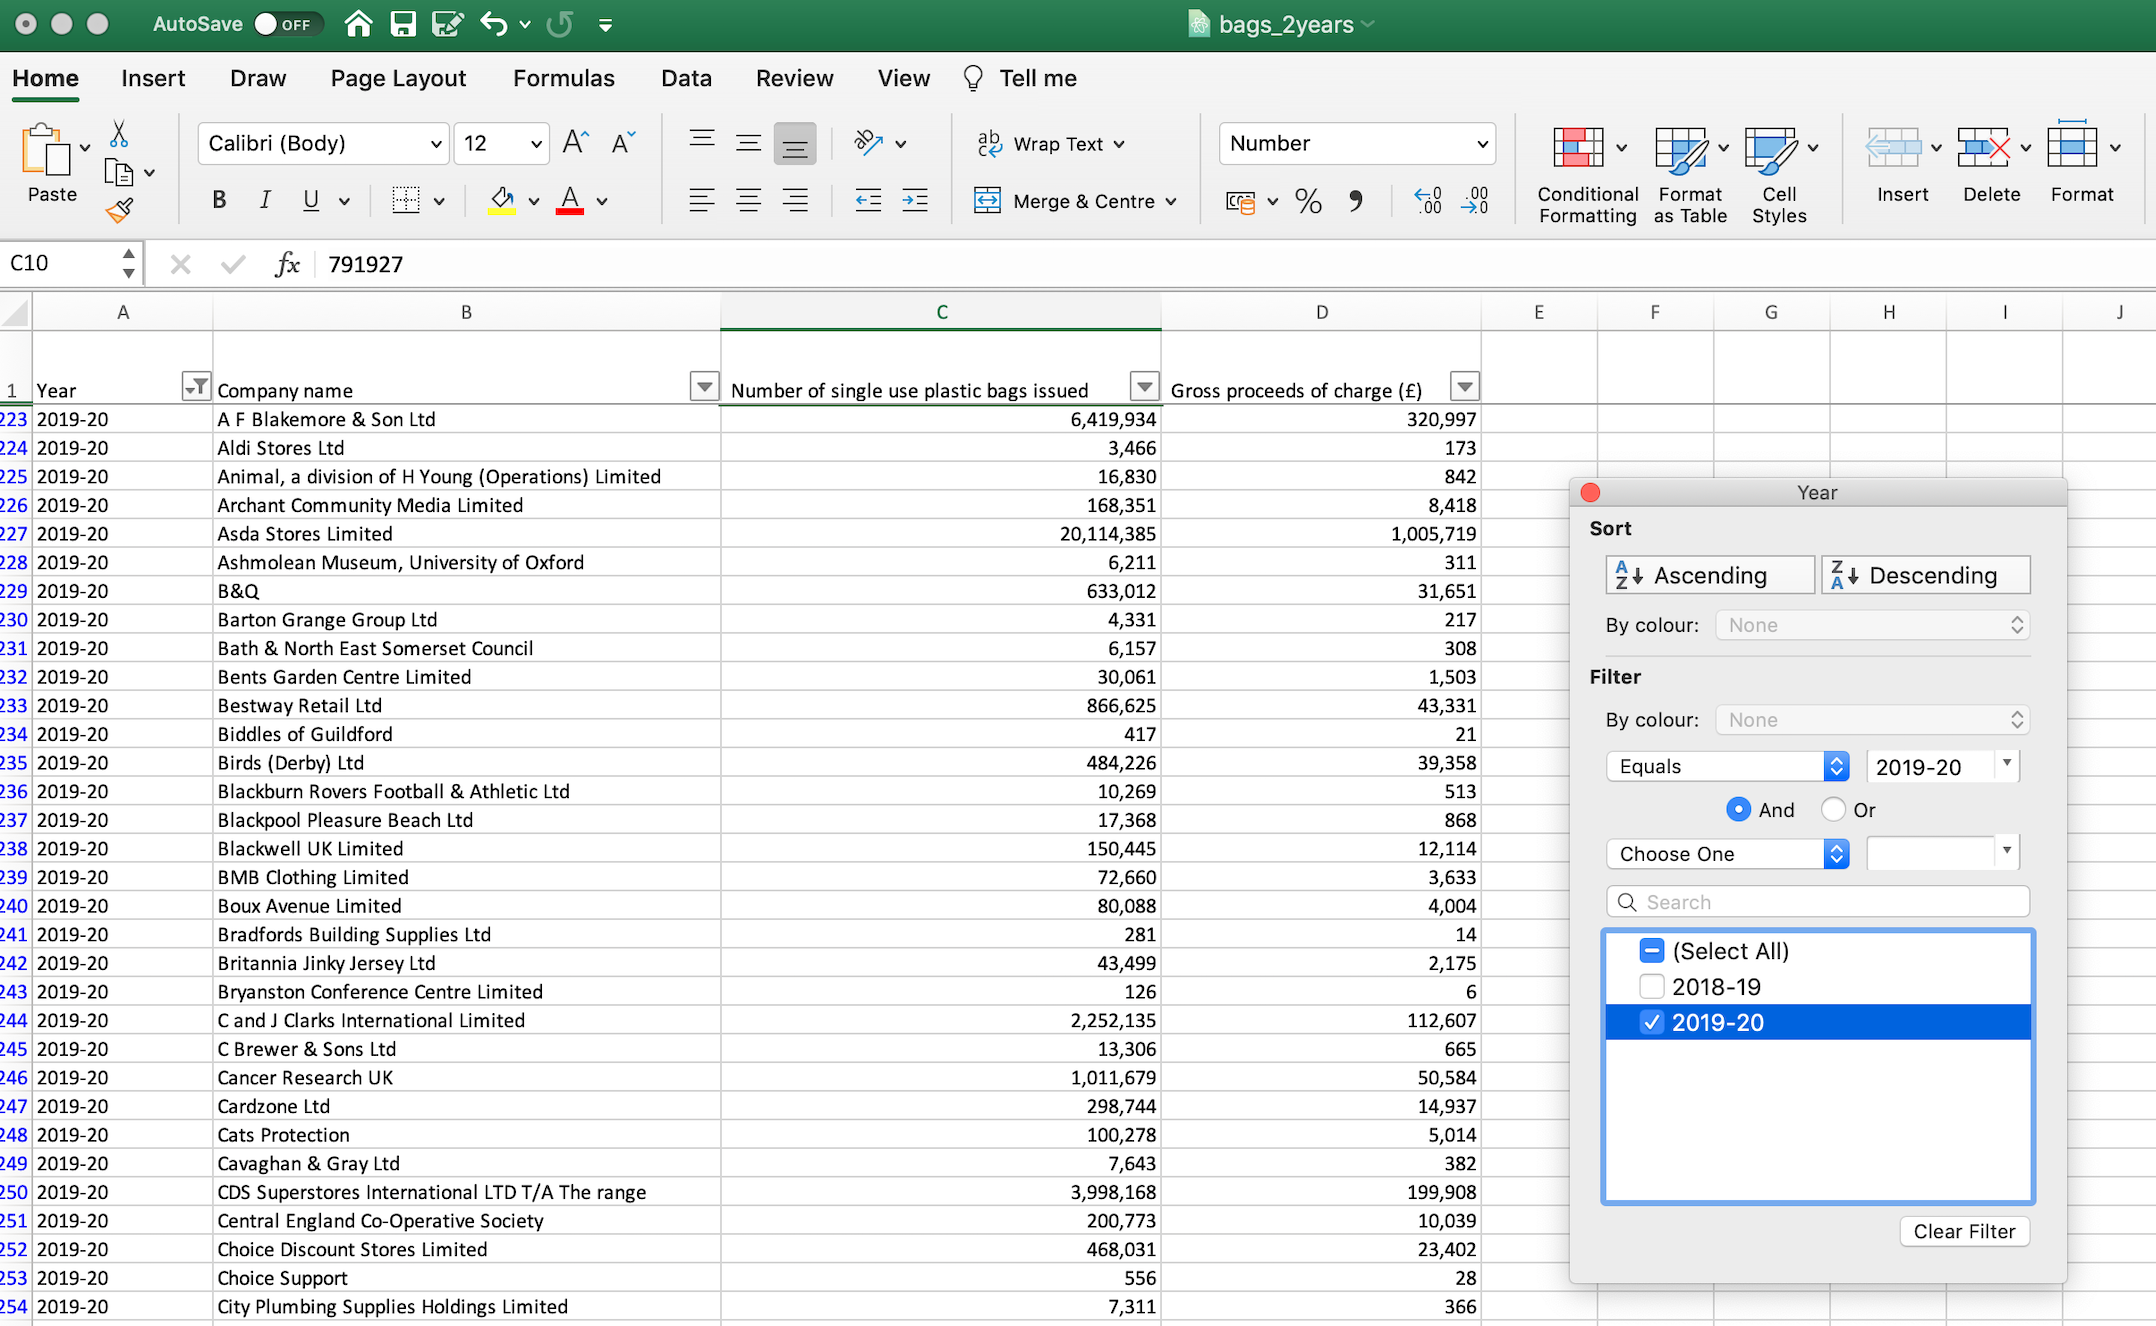
Now you can filter a column using the drop down menus that have been added to the column names. You can select, for example, only the 2019-20 rows by using the filter that’s on the column ‘Year’
Go back to the Sort & Filter button and uncheck Filter to turn off the filter
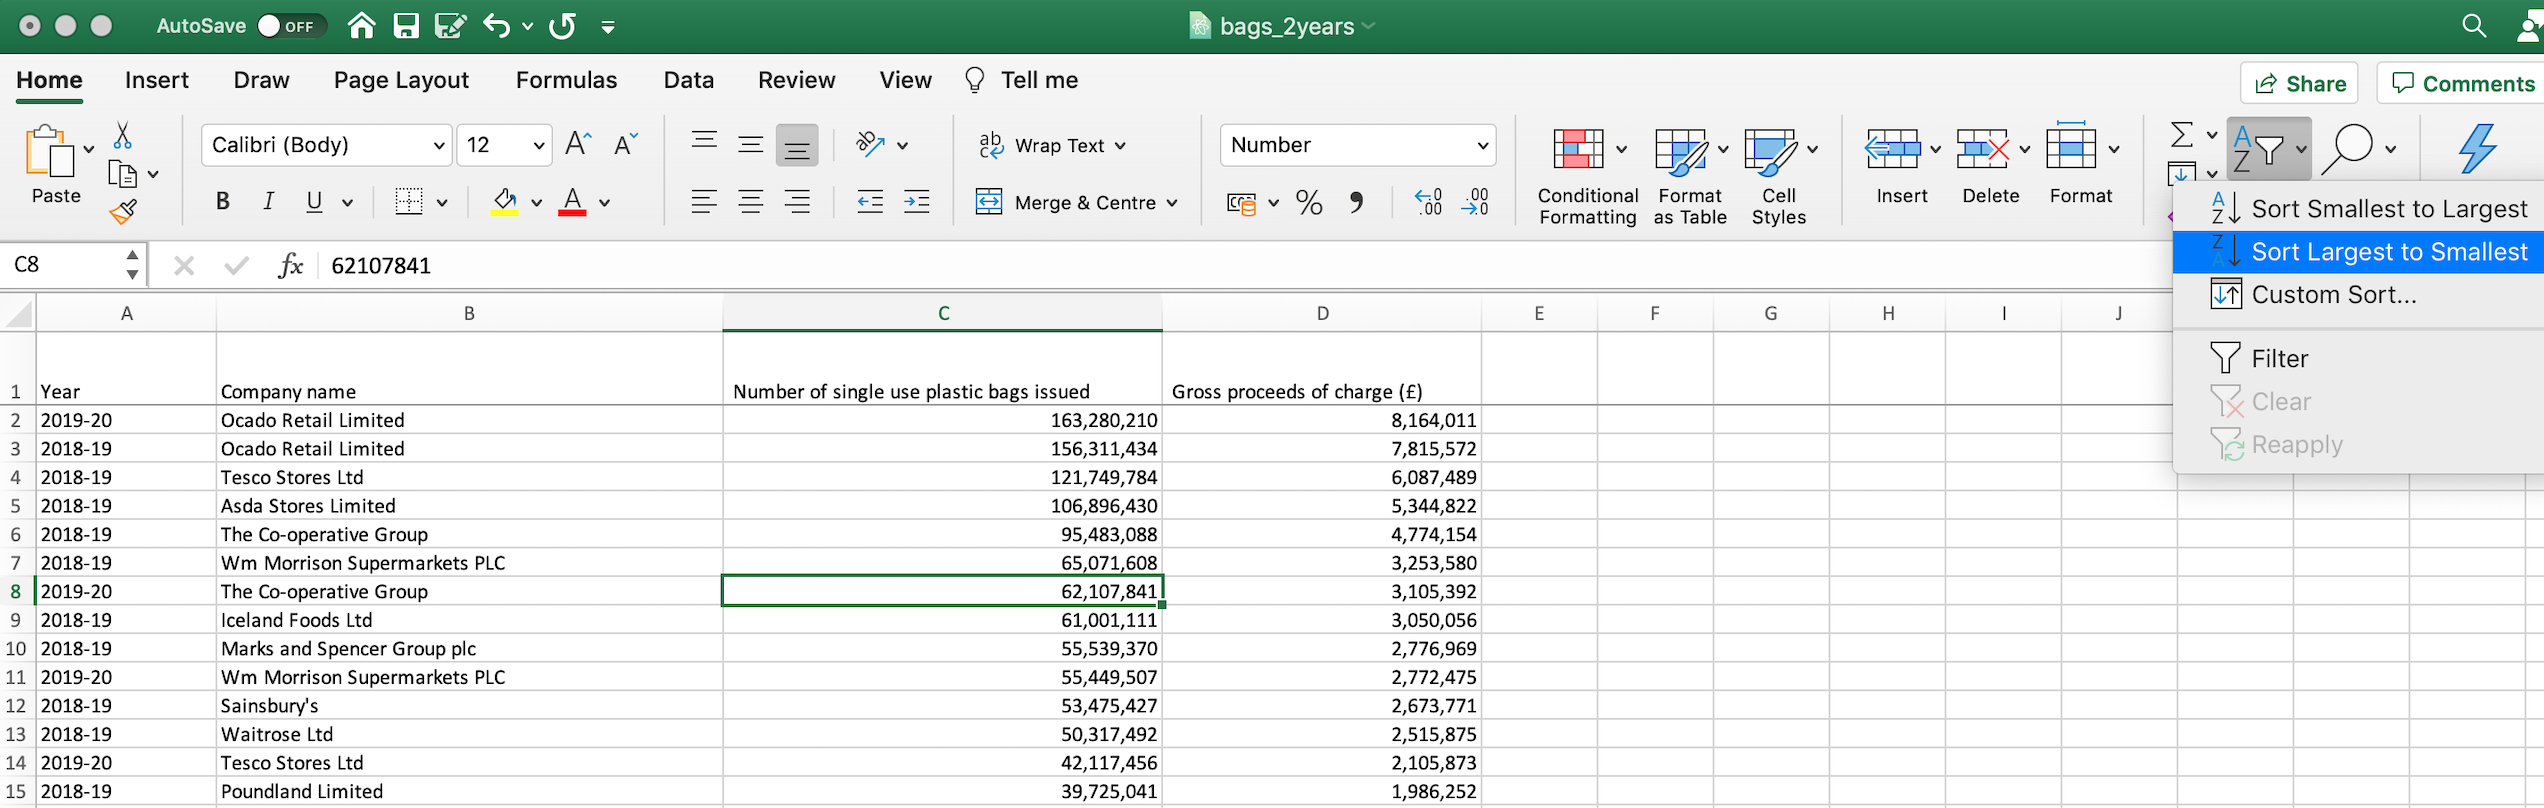
Choose a cell in the ‘Number of single-use plastic bags issued’ and under Sort and Filter choose Sort Largest to Smallest so that all the rows are organised in terms of the number of bags:
Or we can sort Column B alphabetically to organise the companies by name.
ALTERNATIVE: GOOGLE SHEETS
Google Sheets is a light, fast, online alternative to Microsoft Excel and many of its menus and functionalities are very similar to Excel’s. It requires a Google account. The above walkthrough is available with a few small differences here: